| Doppler effect | Position-velocity diagram | Channel maps | Lightechoes | Coordinate systems |
| Radiation transport | ||||
Conceptual and theoretical background of Shape |
| Doppler-effect
The Doppler-effect is the change of the the frequency of a propagating wave as detected by an observer that is moving relative to the source of the wave. Without it astrophysics would be severely handicaped. Probably the most fundamental discovery made by measuring velocities based on the Doppler-effect is that of the expansion of the universe by Edwin Hubble as a correlation between the distance of galaxies with the shifted frequencies of spectral lines in distant galaxies. The change in frequency can be observed in any type of waves, surface waves in water, sound or electromagnetic waves like radio or light. The amount of change depends on the relative velocities between the source, the propagating medium and the receiver. Police uses the Doppler-effect to measure the speed of cars on the road by bouncing short radio waves off the vehicles and measuring the change in frequency of the reflected signal. For further information on the Doppler-effect outside the context of its application in Shape see e.g. the article on Wikipedia and references therein. In many astrophysical objects there is direct correlation between position and velocity. Therefore, if we can measure the velocity along the line of sight, we can hope to disentangle the information of position that appears flattened in images. I n addition to images, in Shape the Doppler-effect is a key measurable piece of information that helps reconstruct the 3D structure of many object types using position-velocity diagrams or channel maps.
|
|
Position-Velocity diagrams
In many astrophysical environments there is a quite well defined relation between the velocity vector field and the position vectors. Examples are the surfaces of rotating stars or accretion disk governed by gravity. In both types of objects the rotation determines the direction of the vectors and in the accretion disk gravity provides the magnitude as a function of distance. In explosive events, like a supernova or ejecta from other stellar events, the gas motion is often radial, just like the position vector with respect to the star. Furthermore, if the ejection is ballistic and from a short event, then the material soon will be sorted according to its speed: the further away, the faster it moves, resulting in a proportionality between the position and velocity vectors. If sufficient constraints exist, such relationsships between position and velocity vectors can be applied to reconstruct the 3D structure of an object by measuring the projected position vectors in an image and deriving the position along the line of sight from the Doppler-shift in sprectroscopic observations. In addition to images, spectroscopic observations of the velocity along the line of sight are one of the key elements for 3D reconstructions using Shape. The first type of spectroscopic information that was produced in Shape to be directly compared with observations where position-velocity (p-v) diagrams (see the illustrations on the right). P-V diagrams are still the most common type of observation for 3D reconstructions in Shape. |
|
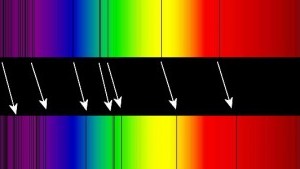
| Spectroscopy is probably the most powerful diagnostic tool in astrophysics. A spectrograph splits up the light from the object as a function of wavelength, just like a rainbow. When using a long, but narrow slit through which the light passes, in a motion-less object the spectral lines are straight lines. | 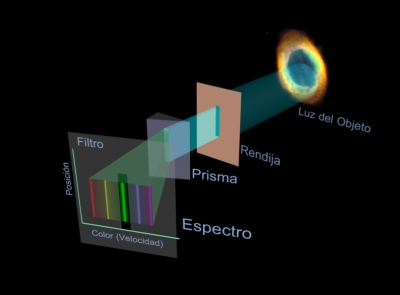 |
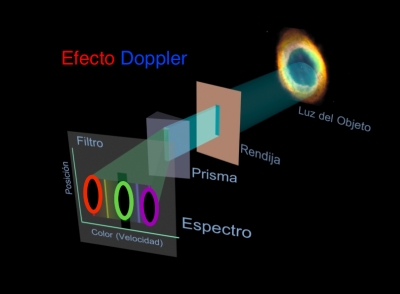 |
However, if, for instance, a nebula is expanding rapidly, then the frequency and wavelength of the gas is shifted towards the red or blue side of the spectrum, depending on whether they are receding or approaching the observer. A roughly spherical expansion produces an ellipsoidal spectral line shape. |
| If we separate a single line, and show the direction along the slit vertically and the wavelength horizontally, then we obtain the so called position-velocity diagram or, for short, p-v diagram. Here the wavelength shift has been replaced by the equivalent velocity along the line of sight. | 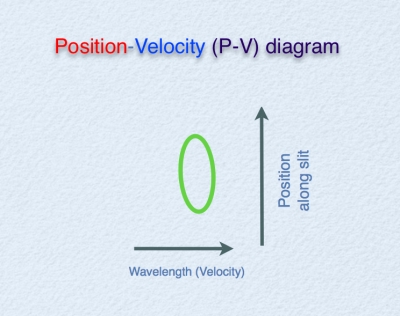 |
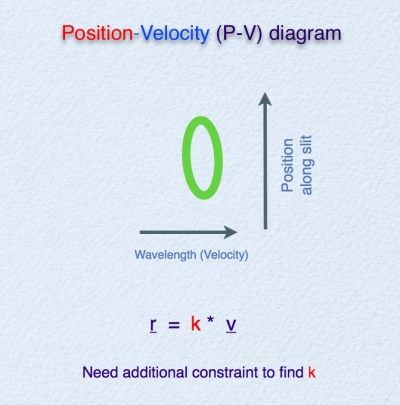 |
If we now find how the velocity is related to the position, we can rescale the velocity axis by the corresponding position and thereby obtain a spatial reconstruction of a slice through the nebula. When a large number of such observations are available a complete 3D map may be constructed. |
| A sequence of adjacent p-v diagrams can be stacked together to produce a "data cube", with two spatial dimensions and one wavelength or velocity dimension. If a linear relation exists between position and velocity, then the appropriately scaled data cube represents a direct reconstruction of the spatial distribution of the emission from that spectral line. Each p-v diagram is a "slice" of the object. | 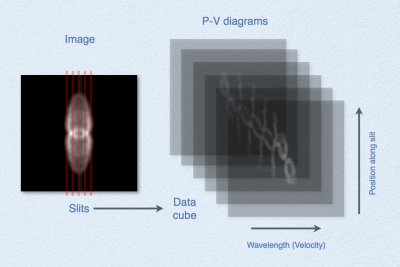 |
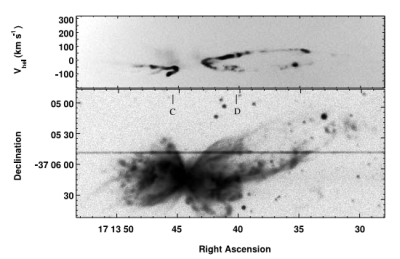 |
An example of a position-velocity diagram (top) and the image of the object from which the p-v diagram was obtained. The spectrograph slit position is marked in the image as a dark horizontal line that crosses the nebula. The horizontal position in the p-v diagram correspongs to the same position in the image along that slit. In the p-v diagram, the vertical position corresponds to the velocity along the line of sight as determined from the Doppler-shift of the spectral line. Often p-v diagrams are shown with the velocity along the horizontal and position along the vertical axis. This is the convention in Shape. Image: Meaburn et al., 2005 (AJ, 130, 2303-2311). See the publication on the ShapeSite to see a reconstruction of this butterfly nebula. |
|
A channel map is an image that contains only emission from within a given interval of velocities along the line of sight, i.e. a certain velocity "channel". Channel maps are the most common form of displaying velocity information in molecular radio observations. A "stack" of channel maps is called a "data cube", with two spatial dimensions and one velocity dimension. In Shape you can use channel maps a in a similar way as position-velocity diagrams to reconstruct the 3D structure of an object, if the mapping between the velocity and spatial component can be derived. If this mapping is linear, then each channel map represents a "slice" through the object. While a p-v diagram is a slice along the line of sight, a channel map is a slice in the plane of the sky. At optical wavelengths channel map are the natural representation of the results from Fabry-Perot observations. A Fabry-Perot etalon is basically a tunable filter, through which passes only a very narrow range of wavelengths, i.e. velocities. It allows the observer to step through a limited spectral range and record adjacent velocity "channels". |
|
 |
 |
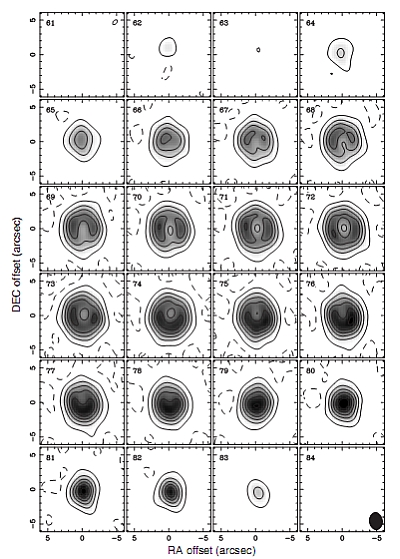
| A set of observed channel maps of the SMA compact array data in the CO J = 3−2 line of IRAS 07134+1005 . The velocities in km/s are marked in the top left corner of each channel map. (Image: Nakashima et al. 2009, ApJ,S 692, 402) |
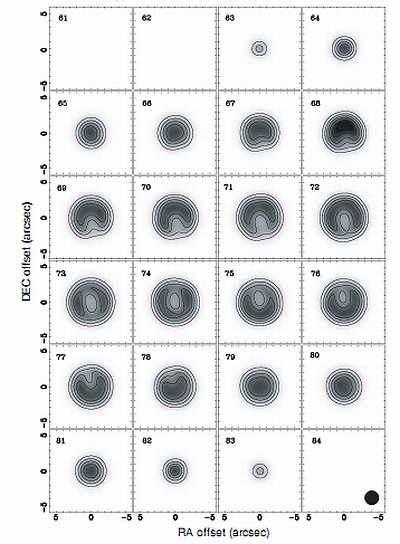
A set of model channel maps for IRAS 07134+1005 generate in Shape. (Image: Nakashima et al. 2009, ApJ,S 692, 402) |
|
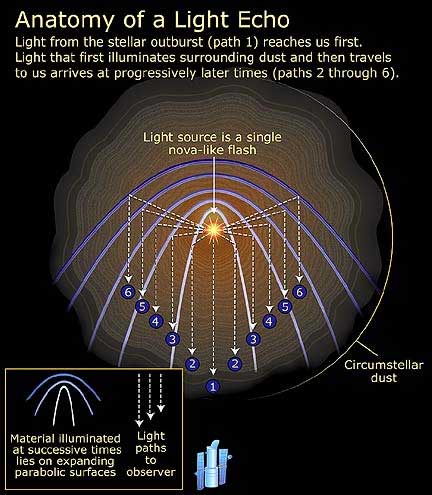
Light echoes occur when the emission from a highly variable light source is reflected of the dust or gas around the source and the reflection changes with a time difference that is larger that the time scale of the variability. It then produces an expanding reflection pattern in the nebula around the light source. |
|
| The most spectacular light echoes observed to date is that of the nova V838 Monocerotis. The image is a sequence showing how the reflecting surface expanded in the dusty envelope of the star. Since it represents a rather thin surface of within the object, the blurring effect of an image of a fully illuminated nebula is not present. Therefore the amount of visible detail is much improved. | 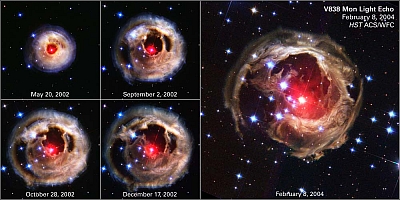 |
|
In a reflecting telescope the mirror usually has a parabolic shape, because it collects light coming from far away in one point, the focus. Furthermore, all rays are synchronized, i.e. "in phase", since the time they it takes them to travel from the object to the focus is the same for all. In a light echo, the light path is reversed. Leaving from the star (focus), at any given time we detect those reflections that come from a parabola within the dust nebula. As time goes on, the parabola from which we receive light changes shape and sweeps through the nebula. In principle, continuous observations of the light echo allows to reconstruct the 3D structure of the nebula. |
| In Shape the light echo images are handled in a similar way as velocity channel maps. For the echoes we have "light travel time" channels. For each point in the object, the light travel time is calculated and its emission is rendered in the corresponding channel. In this example, a red sphere and three parabolas have been modeled (see image below). The parabolas are such that they correspond to a simultaneous reflecting surface and therefore show only in a single time frame or "channel". Each channel corresponds to an image taken at a different time. | 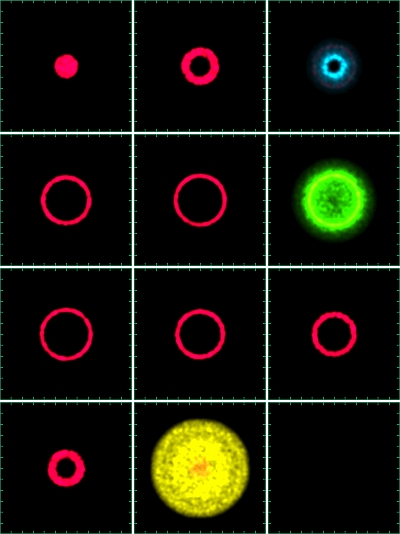 |
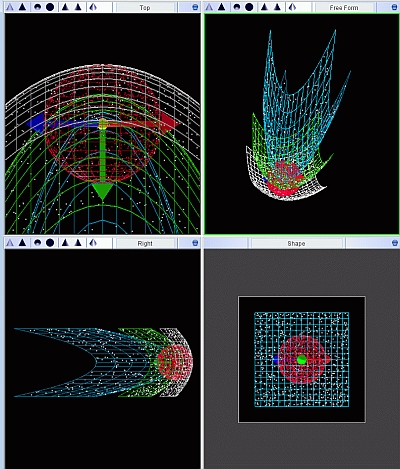 |
The mesh structures that have been imaged as light echoes in the previous figure. |
| Coordinate systems
For now see: modifiers
|
|
See the PDF document on the "Physics in Shape" for information on radiation transport basics and how it is applied and approximated in the Shape.
|