| |
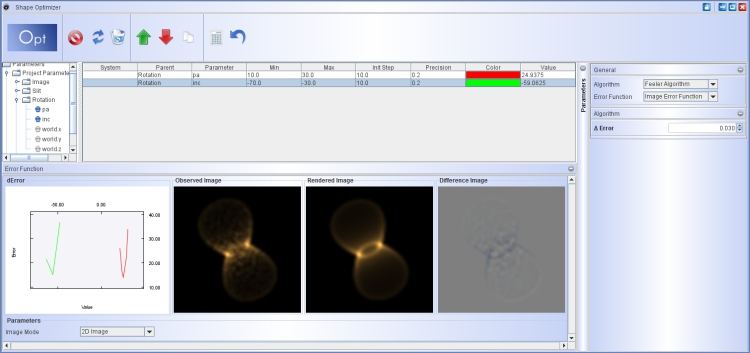
Starting from an initial manually generated model, the Optimizer Module provides a tool to automatically improve the set of parameters. It is also a tool to obtain a more quantitative handle on the precision of the model parameters.
The general strategy is to select one or more variables to optimize from a hierarchical variable tree. Then you set a range of possible values and the precision to which you want to optimize. The initial values are taken from the current project values. Then you load an observed image or P-V diagram which drives the minimization process. Once you start the optimization process, the model is compared with the observation to generate a least-squares difference. The value of the variables are varied over the range that was preset to find the least-squares solution and in the order as they appear in the stack. The cycle of optimization is repeated until a minimum difference is achieved.
The Optimizer Module is divided into five sections: the Toolbar, the variable tree, the variable stack, the parameter panel and the image display.
You start an optimization process by clicking on the large blue Opt button of the toolbar.

Stop an optimization process with the cancel button

When you change or add parameters in another module, the optimizer module needs to be refreshed. Use the update button to include any such changes in the variable tree and stack .

To delete an item from the variable stack click on the trash can.

The order in which the optimization of several variables can be controlled is by moving them up or down in the variable stack. To move a variable in the stack select the variable and click on the up or down arrows.
 
The copy button allows you to copy the same variable multiple time into the stack. Select the variable and click copy.

|
Similar to the Animation Moduel, in the Optimizer Module you select the varaiables from a hierarchical variable tree. You can open the sublevels by clicking on the little handles or by double-clicking on the folder icons. The click on the grey marble near the variable name that you would like to enable for optimization. The variable then shows up in the variable stack.

The variable stack contains the variables that are to be optimized.
You can control the order of a multi-variable optimization by using the up-down arrows. If you have more than two variables it might be useful to predetermine in which order variables should be optimized in an extended optimization cycle. With the copy button you can reproduce the same variable more than once, such that the basic cycle can be repeated in any order. Say, first xyz, then zxy, etc. It is important to select reasonable values for the initial parameters of a variables, especially the Precision. If the precision value is very small, the process might not converge, since there might be many local minima in the error function. |
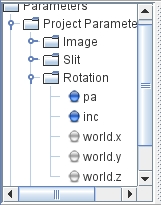
Variables to be optimized are selected from a hierarchical variable tree.
|
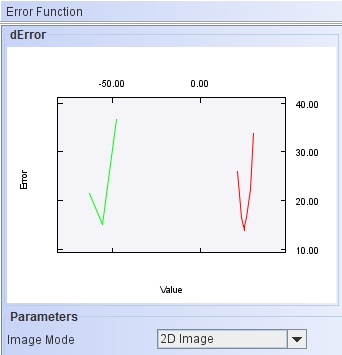
A different color can be assigned to every stack item. To change a color click on the color swatch in the stack and select from the color dialog that opens. These colors will be used in the error graph to display how this variable and its error function changes during the optimization. Each cycle of optimization is displayed in the error function display.
|
The observed, rendered model and difference image are displayed alongside each other. If the interface or screen area is not large enough, a scroll bar allows you bring possibly hidden images into view. The difference image is updated for every interpolation step. The root-mean-square (rms) of the difference image is used for the error function and minimized for optimization.
The observed image is taken from the settings in the Rendering Module. If you use a P-V diagram for optimizing, then make sure to load an observed P-V diagram in the corresponding display of the Rendering Module and select PV diagram in the Image mode drop-down menu below the images.
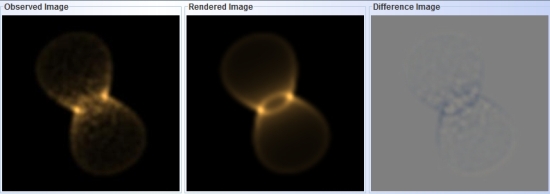
Tip: A very clumpy observed image (like it the simulated observed image above) might lead to many local minima in the error function.Depending on the variable that you are optimizing, for instance position angle or inclination, it might be useful to smooth out these irregularities with a sufficiently wide gaussian kernel.
|
|